Review: DataRobot aces automated machine learning
DataRobot’s end-to-end AutoML suite not only speeds up the creation of accurate models, but can combine time series, images, geographic information, tabular data, and text in a single model.


Contributing Editor, InfoWorld |

-
DataRobot 6.2
Data science is nothing if not tedious, in ordinary practice. The initial tedium consists of finding data relevant to the problem you’re trying to model, cleaning it, and finding or constructing a good set of features. The next tedium is a matter of attempting to train every possible machine learning and deep learning model to your data, and picking the best few to tune.
Then you need to understand the models well enough to explain them; this is especially important when the model will be helping to make life-altering decisions, and when decisions may be reviewed by regulators. Finally, you need to deploy the best model (usually the one with the best accuracy and acceptable prediction time), monitor it in production, and improve (retrain) the model as the data drifts over time.
AutoML, i.e. automated machine learning, can speed up these processes dramatically, sometimes from months to hours, and can also lower the human requirements from experienced Ph.D. data scientists to less-skilled data scientists and even business analysts. DataRobot was one of the earliest vendors of AutoML solutions, although they often call it Enterprise AI and typically bundle the software with consulting from a trained data scientist. DataRobot didn’t cover the whole machine learning lifecycle initially, but over the years they have acquired other companies and integrated their products to fill in the gaps.
As shown in the listing below, DataRobot has divided the AutoML process into 10 steps. While DataRobot claims to be the only vendor to cover all 10 steps, other vendors might beg to differ, or offer their own services plus one or more third-party services as a “best of breed” system. Competitors to DataRobot include (in alphabetical order) AWS, Google (plus Trifacta for data preparation), H2O.ai, IBM, MathWorks, Microsoft, and SAS.
The 10 steps of automated machine learning, according to DataRobot:
- Data identification
- Data preparation
- Feature engineering
- Algorithm diversity
- Algorithm selection
- Training and tuning
- Head-to-head model competitions
- Human-friendly insights
- Easy deployment
- Model monitoring and management
DataRobot platform overview
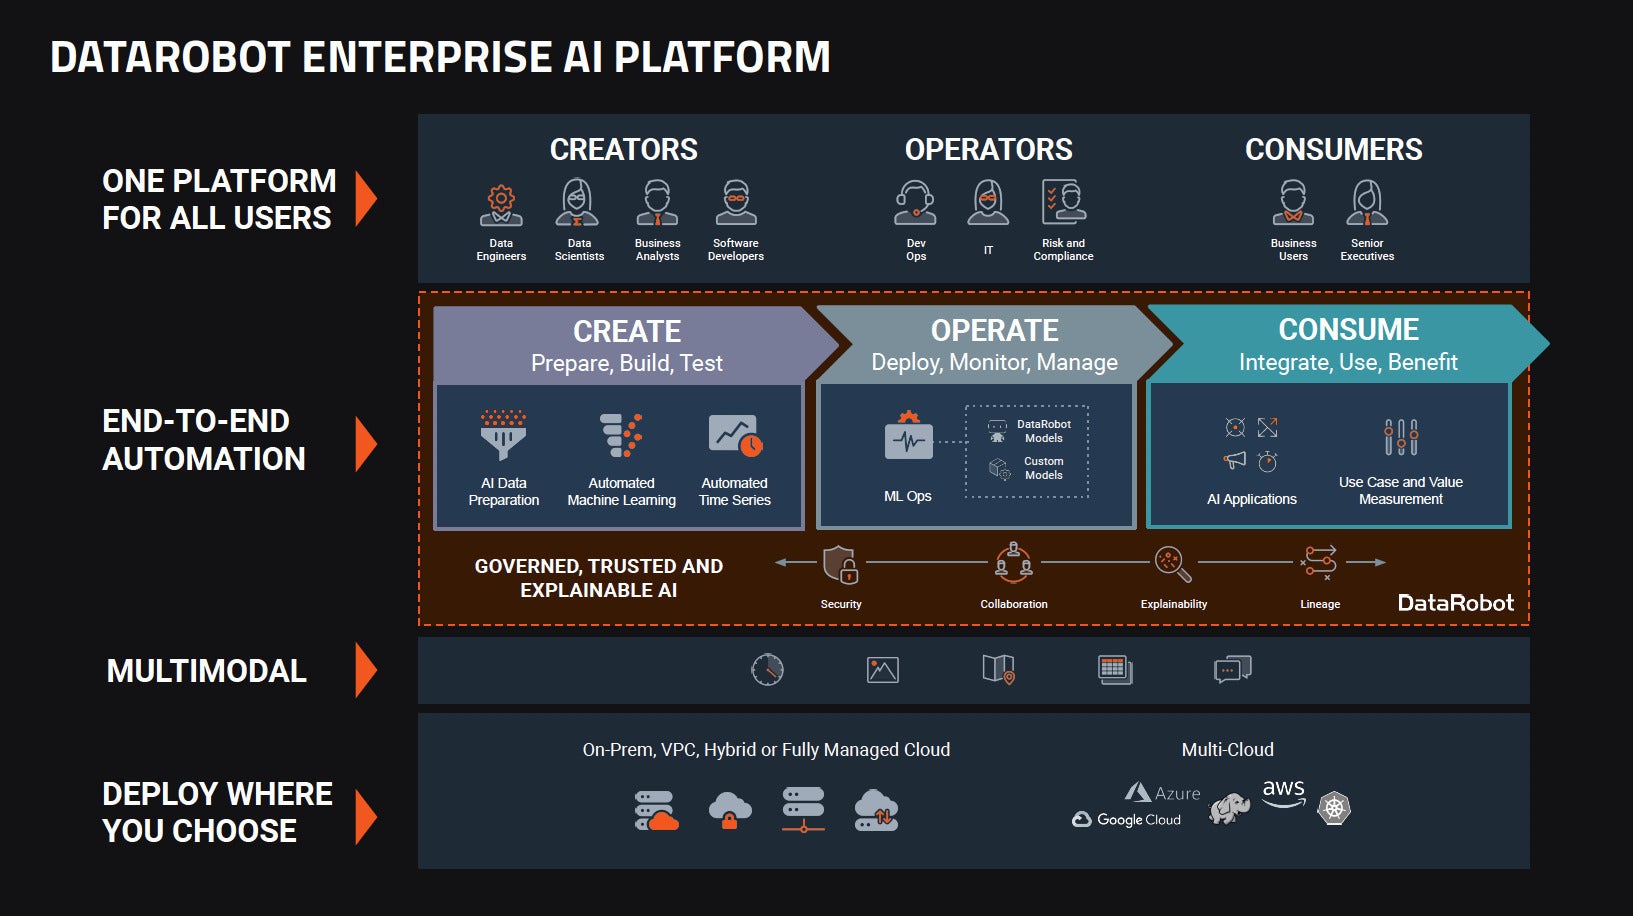
As you can see in the slide below, the DataRobot platform tries to address the needs of a variety of personas, automate the entire machine learning lifecycle, deal with the issues of model explainability and governance, deal with all kinds of data, and deploy pretty much anywhere. It mostly succeeds.
DataRobot helps data engineers with its AI Catalog and Paxata data prep. It helps data scientists primarily with its AutoML and automated time series, but also with its more advanced options for models and its Trusted AI. It helps business analysts with its easy-to-use interface. And it helps software developers with its ability to integrate machine learning models with production systems. DevOps and IT benefit from DataRobot MLOps (acquired in 2019 from ParallelM), and risk and compliance officers can benefit from its Trusted AI. Business users and executives benefit from better and faster model building and from data-driven decision making.
End-to-end automation speeds up the entire machine learning process and also tends to produce better models. By quickly training many models in parallel and using a large library of models, DataRobot can sometimes find a much better model than skilled data scientists training one model at a time.
A quote from an associate professor of information management on one of DataRobot’s web pages essentially says that DataRobot AutoML managed to find a model in one hour(!) that outperformed (by a factor of two!) the best model a skilled grad student was able to train in a few months, because the student had missed a class of algorithms that worked well for the data. Your mileage may vary, of course.
In the row marked multimodal in the diagram below, there are five icons. At first they confused me, so I asked what they mean. Essentially, DataRobot has models that can handle time series, images, geographic information, tabular data, and text. The surprising bit is that it can combine all of those data types in a single model.
DataRobot offers you a choice of deployment locations. It will run on a Linux server or Linux cluster on-premises, in a cloud VPC, in a hybrid cloud, or in a fully managed cloud. It supports Amazon Web Services, Microsoft Azure, or Google Cloud Platform, as well as Hadoop and Kubernetes.
 DataRobot
DataRobot platform diagram. Several of the features were added to the platform through acquisitions, including data preparation and MLOps.
Paxata data prep
DataRobot acquired self-service data preparation company Paxata in December 2019. Paxata is now integrated with DataRobot’s AI Catalog and feels like part of the DataRobot product, although you can still buy it as a standalone product if you wish.
Paxata has three functions. First, it allows you to import datasets. Second, it lets you explore, clean, combine, and condition the data. And third, it allows you to publish prepared data as an AnswerSet. Each step you perform in Paxata creates a version, so that you can always continue to work on the data.
Data cleaning in Paxata includes standardizing values, removing duplicates, finding and fixing errors, and more. You can shape your data using tools such as pivot, transpose, group by, and more.
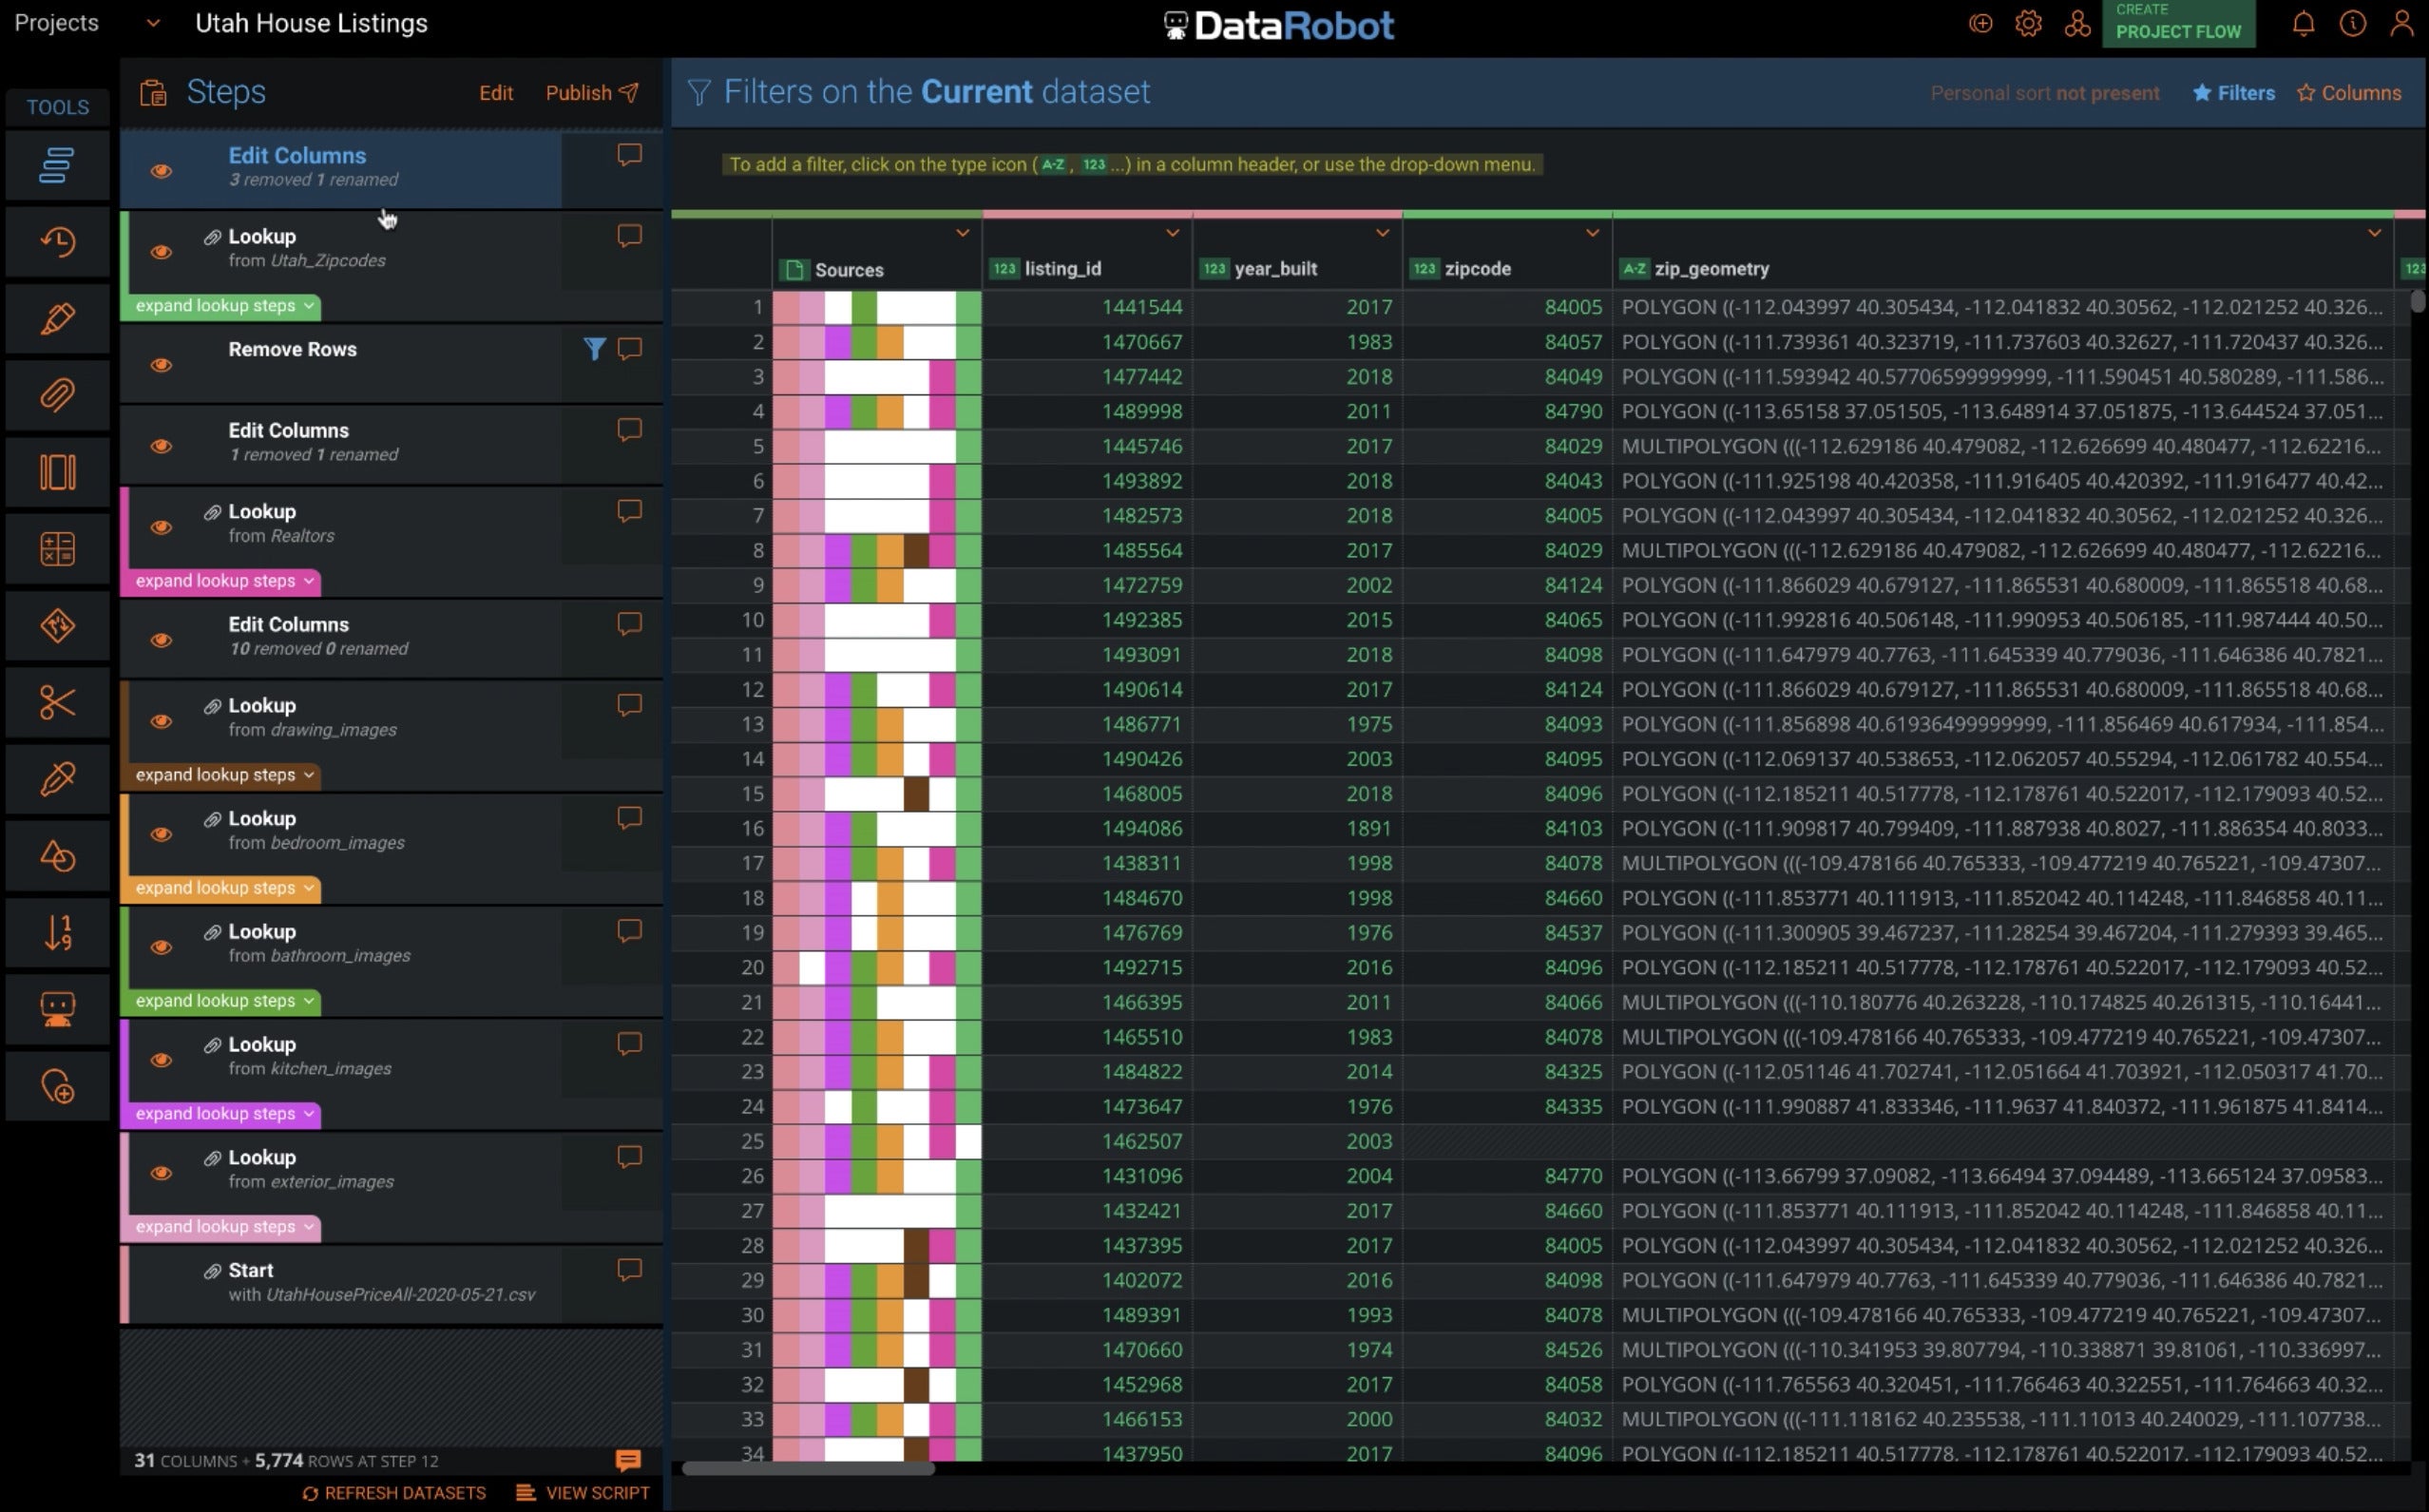
The screenshot below shows a real estate dataset that has a dozen Paxata processing steps. It starts with a house price tabular dataset; then it adds exterior and interior images, removes unnecessary columns and bad rows, and adds ZIP code geospatial information. This screenshot is from the House Listings demo.
 IDG
IDG
Paxata allows the user to construct AnswerSets from datasets one step at a time. The Paxata tools all have a GUI, although the Compute tool lets the user enter simple formulas or build advanced formulas using columns and functions.
DataRobot automated machine learning
Basically, DataRobot AutoML works by going through a couple of exploratory data analysis (EDA) phases, identifying informative features, engineering new features (especially from date types), then trying a lot of models with small amounts of data.
EDA phase 1 runs on up to 500MB of your dataset and provides summary statistics, as well as checking for outliers, inliers, excess zeroes, and disguised missing values. When you select a target and hit run, DataRobot “searches through millions of possible combinations of algorithms, preprocessing steps, features, transformations, and tuning parameters. It then uses supervised learning algorithms to analyze the data and identify (apparent) predictive relationships.”
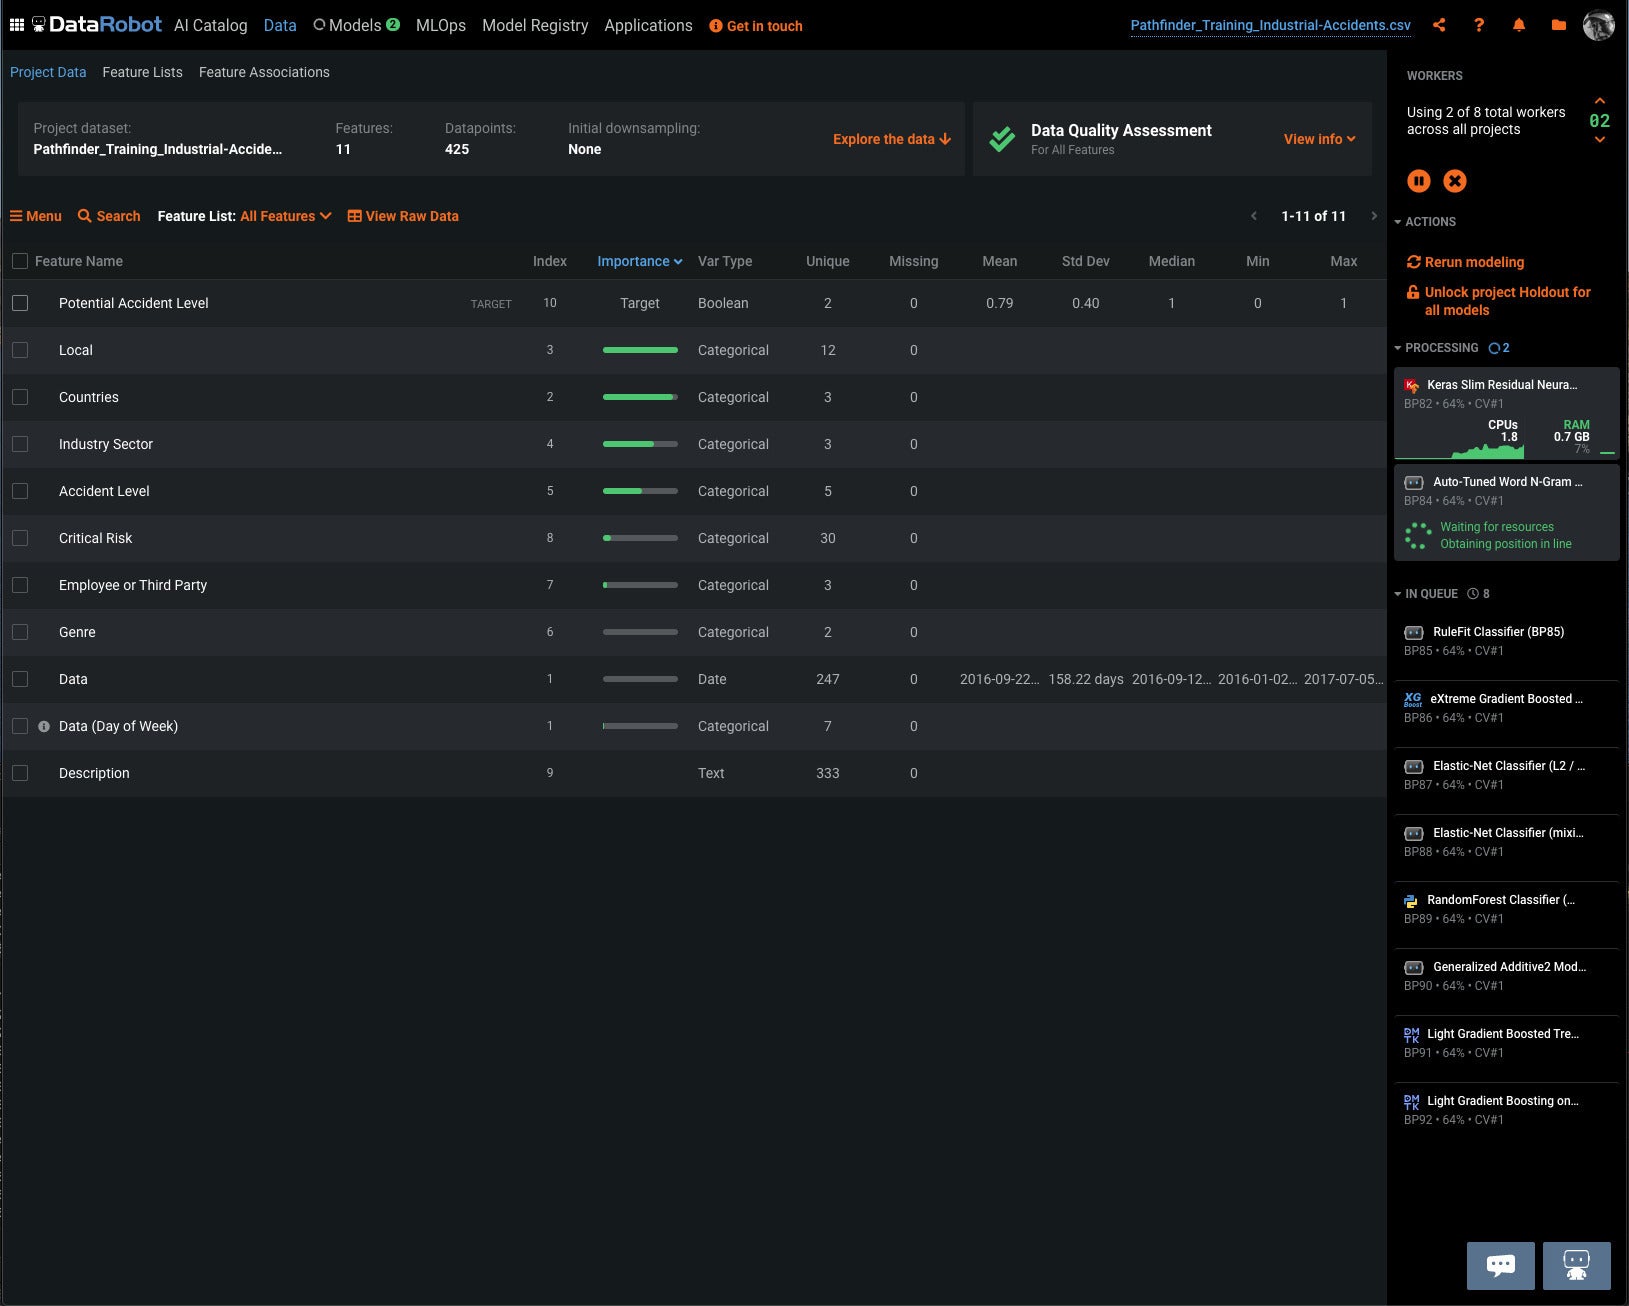
DataRobot autopilot mode starts with 16% of the data for all appropriate models, 32% of the data for the top 16 models, and 64% of the data for the top eight models. All results are displayed on the leaderboard. Quick mode runs a subset of models on 32% and 64% of the data. Manual mode gives you full control over which models to execute, including specific models from the repository.
 IDG
IDG
DataRobot AutoML in action. The models being trained are at the right, along with the percentage of the data being used for training each model.
DataRobot time-aware modeling
DataRobot can do two kinds of time-aware modeling if you have date/time features in your dataset. You should use out-of-time validation (OTV) when your data is time-relevant but you are not forecasting (instead, you are predicting the target value on each individual row). Use OTV if you have single event data, such as patient intake or loan defaults.
You can use time series when you want to forecast multiple future values of the target (for example, predicting sales for each day next week). Use time series to extrapolate future values in a continuous sequence.
In general, it has been difficult for machine learning models to outperform traditional statistical models for time series prediction, such as ARIMA. DataRobot’s time series functionality works by encoding time-sensitive components as features that can contribute to ordinary machine learning models. It adds columns to each row for examples of predicting different distances into the future, and columns of lagged features and rolling statistics for predicting that new distance.
 IDG
IDG
Values over time graph for time-related data. This helps to determine trends, weekly patterns, and seasonal patterns.
DataRobot Visual AI
In April 2020 DataRobot added image processing to its arsenal. Visual AI allows you to build binary and multi-class classification and regression models with images. You can use it to build completely new image-based models or to add images as new features to existing models.
Visual AI uses pre-trained neural networks, and three new models: Neural Network Visualizer, Image Embeddings, and Activation Maps. As always, DataRobot can combine its models for different field types, so classified images can add accuracy to models that also use numeric, text, and geospatial data. For example, an image of a kitchen that is modern and spacious and has new-looking, high-end appliances might result in a home-pricing model increasing its estimate of the sale price.
There is no need to provision GPUs for Visual AI. Unlike the process of training image models from scratch, Visual AI’s pre-trained neural networks work fine on CPUs, and don’t even take very long.
 IDG
IDG
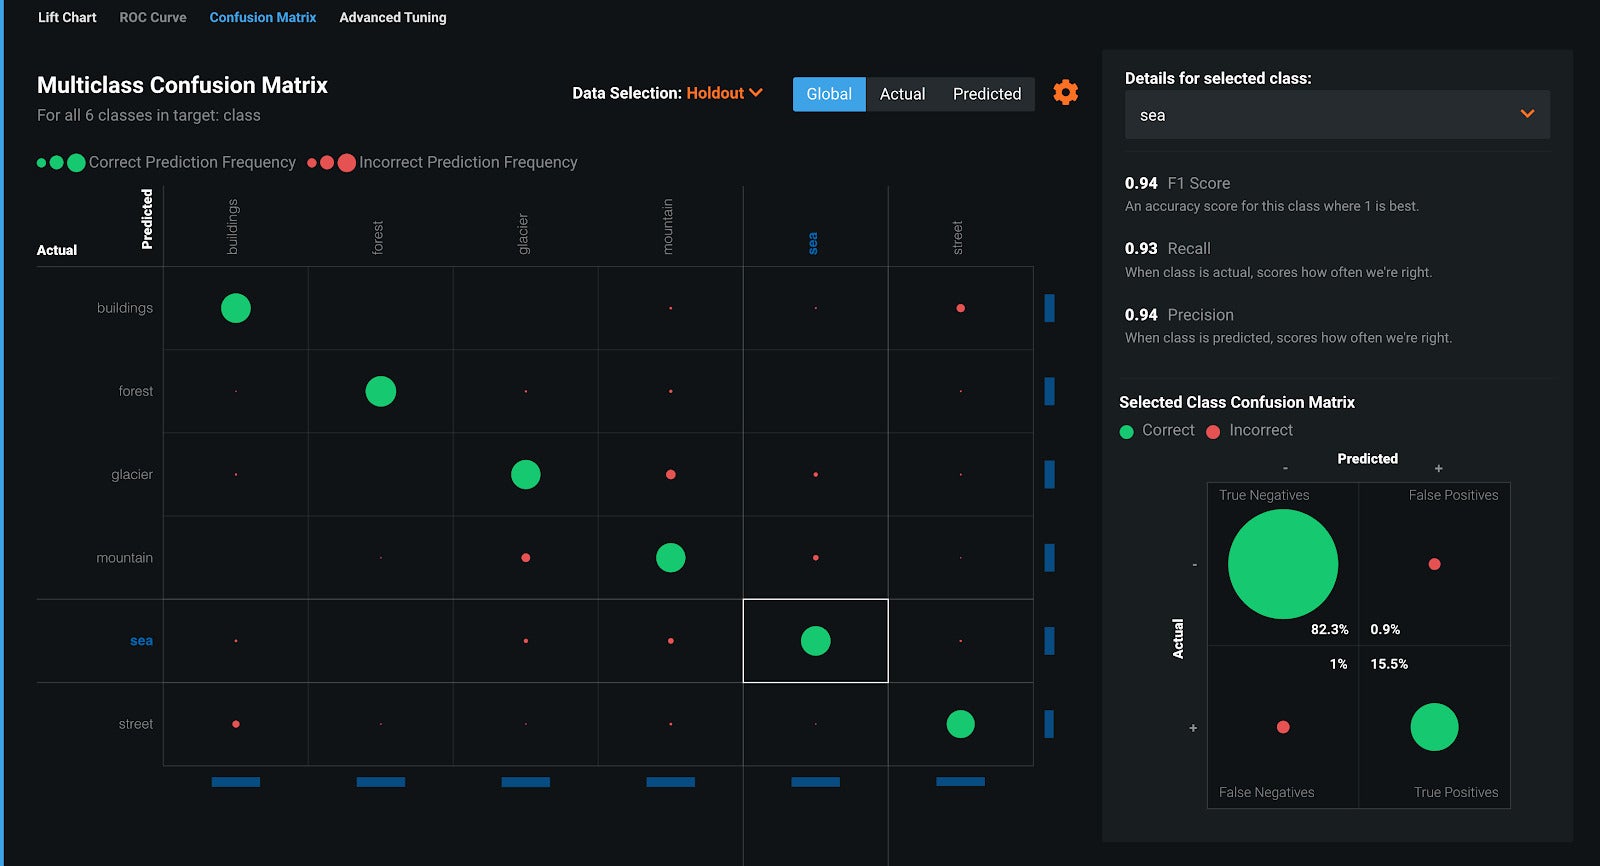
This multi-class confusion matrix for image classification shows a fairly clean separation, with most of the predictions true positives or true negatives.
 IDG
IDG
The color overlays in these home exterior images from the House Listings demo highlight the features the model factored into its sale price predictions. These factors were combined with other fields, such as square footage and number of bedrooms.
DataRobot Trusted AI
It’s easy for an AI model to go off track, and there are numerous examples of what not to do in the literature. Contributing factors include outliers in the training data, training data that isn’t representative of the real distribution, features that are dependent on other features, too many missing feature values, and features that leak the target value into the training.
DataRobot has guardrails to detect these conditions. You can fix them in the AutoML phase, or preferably in the data prep phase. Guardrails let you trust the model more, but they are not infallible.
Humble AI rules allow DataRobot to detect out of range or uncertain predictions as they happen, as part of the MLOps deployment. For example, a home value of $100 million in Cleveland is unheard-of; a prediction in that range is most likely a mistake. For another example, a predicted probability of 0.5 may indicate uncertainty. There are three ways of responding when humility rules fire: Do nothing but keep track, so that you can later refine the model using more data; override the prediction with a “safe” value; or return an error.
Too many machine learning models lack explainability; they are nothing more than black boxes. That’s often especially true of AutoML. DataRobot, however, goes to great lengths to explain its models. The diagram that follows is fairly simple, as neural network models go, but you can see the strategy of processing text and categorical variables in separate branches and then feeding the results into a neural network.
 IDG
IDG
Blueprint for an AutoML model. This model processes categorical variables using one-hot encoding and text variables using word-grams, then factors them all into a Keras Slim Residual neural network classifier. You can drill into any box to see the parameters and get a link to the relevant documentation.
DataRobot MLOps
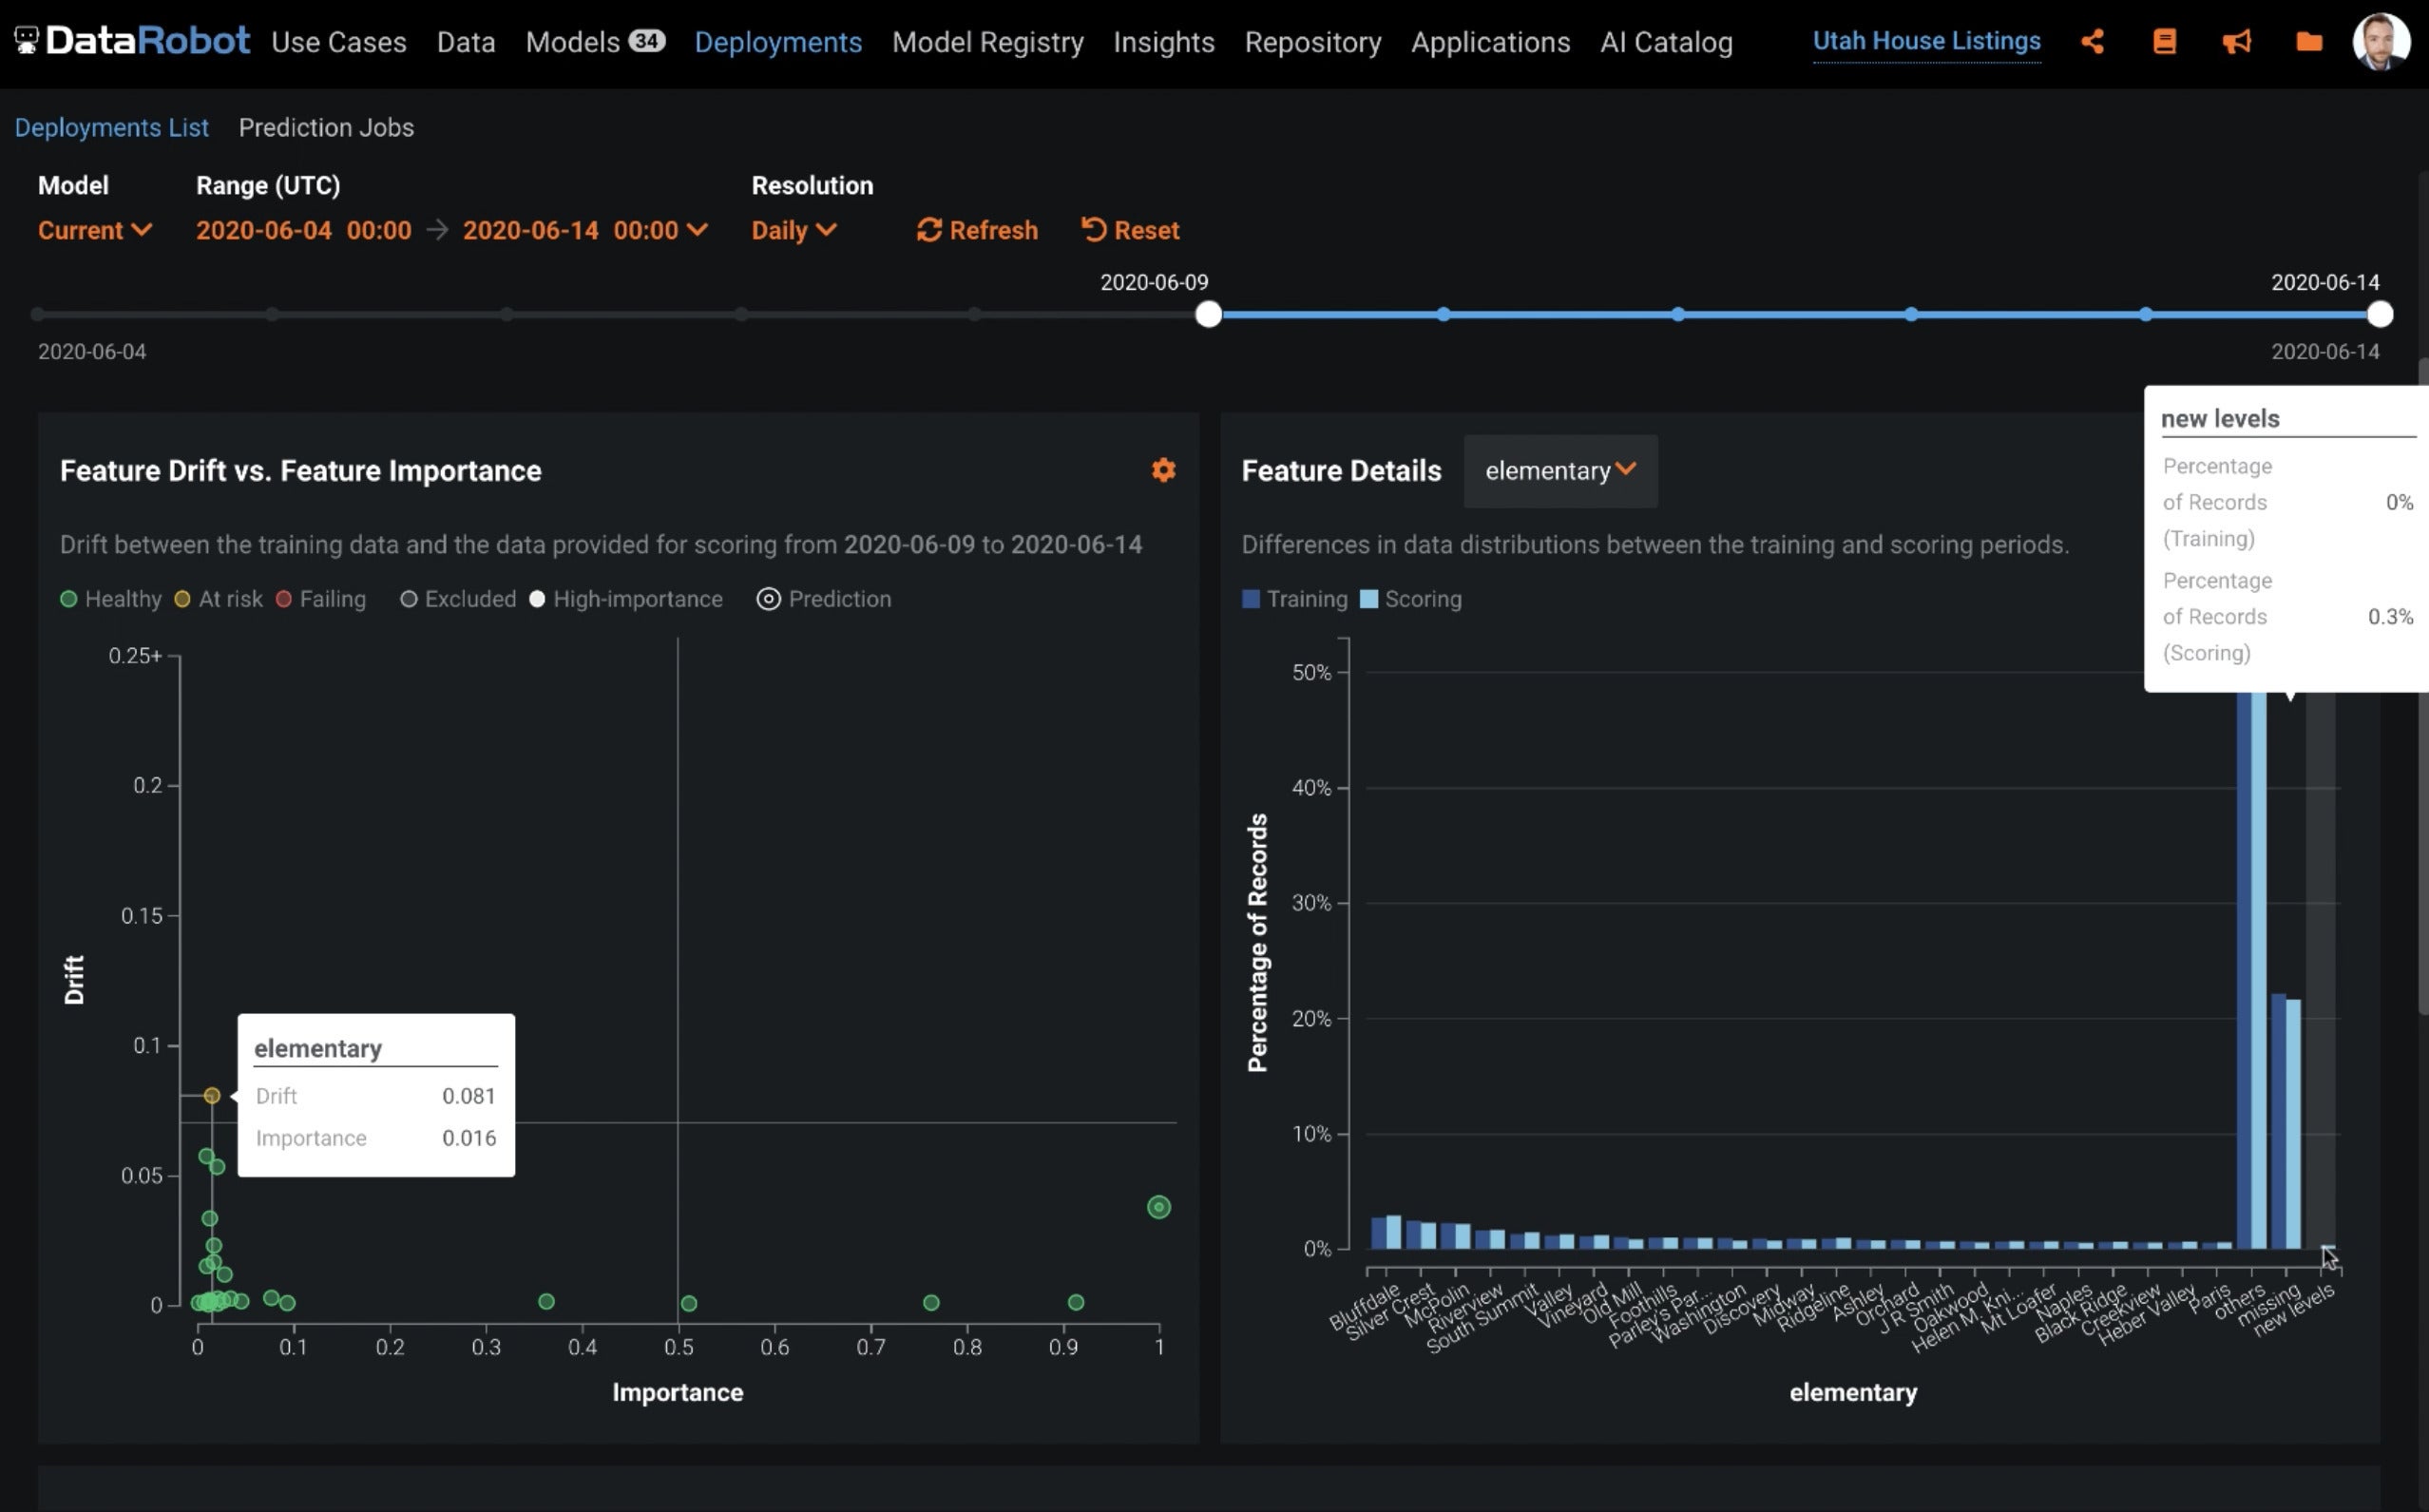
Once you have built a good model you can deploy it as a prediction service. That isn’t the end of the story, however. Over time, conditions change. We can see an example in the graphs below. Based on these results, some of the data that flows into the model — elementary school locations — needs to be updated, and then the model needs to be retrained and redeployed.
 IDG
IDG
Looking at the feature drift from MLOps tells you when conditions change that affect the model’s predictions. Here we see that a new elementary school has opened, which typically raises the value of nearby homes.
Overall, DataRobot now has an end-to-end AutoML suite that takes you from data gathering through model building to deployment, monitoring, and management. DataRobot has paid attention to the pitfalls in AI model building and provided ways to mitigate many of them. Overall, I rate DataRobot very good, and a worthy competitor to Google, AWS, Microsoft, and H2O.ai. I haven’t reviewed the machine learning offerings from IBM, MathWorks, or SAS recently enough to rate them.
I was surprised and impressed to discover that DataRobot can run on CPUs without accelerators and produce models in a few hours, even when building neural network models that include image classification. That may give it a slight edge over the four competitors I mentioned for AutoML, because GPUs and TPUs are not cheap.